Latest News

How AI Can Revolutionise Marketing for Car Dealers
In the ever-changing automotive industry, staying ahead of the competition is key. Marketing plays a crucial role in a car dealer's success, but...
What is Google Analytics?
Whether you're running a small independent dealership or managing a larger franchise, data-driven decisions can significantly impact your sales and...
Understanding your customers’ buying journey
Understanding the consumer journey to buying a new car has never been more crucial. Long gone are the days where people turn up unannounced to...
A Beginner’s Guide to PPC for Car Dealers
Pay Per Click (PPC) for car dealers is a critical tool to have in your marketing arsenal. Here we will outline what PPC is, how it works and why it...
Guide to Google Business Profile: What You Need to Know
A Google Business Profile (formerly known as a Google My Business listing) allows your motor dealership to gain more visibility on Google. By...
The Essential Web Design Features for Car Dealers
A website is essential for any car dealer. But that isn’t enough. You also need to ensure that your website is well equipped to help you sell cars....
Building a Strong Brand Identity for Your Dealership
Standing out from the crowd is crucial for your dealership, and building a strong brand identity can set your business apart and help with long-term...
Struggling with Ideas for Social Media Posts?
Having a strong social media presence is essential for car dealerships looking to connect with potential buyers, retain loyal customers, and grow...
Why is SEO so important to car dealers?
Now more than ever, consumers are relying on digital channels to help them shop for their next vehicle. There’s no moving away from the fact that...
Why a Website is Essential for a Small Business
Having an online presence is not just a luxury for a small independent business; it's a necessity. A well-designed website is a cornerstone for...
How to Sell More: Tips and Tricks for Better Stock Photography
For dealerships looking to boost their sales and attract more customers, good vehicle imagery is crucial. We know that the process of photographing...
Spidersnet Picks Up Another Car Dealer Power Award!
Since Spidersnet began, our ethos has been to consistently deliver excellent service and outstanding products for all of our customers. We are...
Everything You Need to Know About Reviews (And How to Make the Most of Them)
Online reviews can make or break a business. For car dealers, Auto Trader, Google and Facebook stand out as three of the most influential. Positive...
Site Showcase: Plympton Car Centre
Now more than ever, it is important to keep your website looking fresh and up to date. Your website is often the first point of contact for many...
Autopromotor Pro: More detailed ads in an instant thanks to our Enhanced VRM Lookup
The high-end, improved version of our current dealer management system has a variety of great features designed to make your life easier. One of...
7 Reasons Why a Blog Can Drive Sales for Automotive Dealers
You may not think a blog is the most effective way of boosting traffic to your website. However, in the ever-evolving landscape of digital...
Autopromotor PRO – Revolutionise the way you manage your dealership online
Have you tried Autopromotor Pro? This high-spec version of our stock management system comes with a number of amazing new features that are going to...
Introducing Our Vehicle Description Generator
Captivating product descriptions are key to enticing potential car buyers. but we know that busy car dealers may not always have the hours in the...
How Your Customers are Researching Cars (And Why You Need to Know)
We don’t need to tell you that customers aren’t going straight into dealerships on a whim for a wander around the forecourt anymore. As part of a...
The Essential Guide: Maximise Your Potential with Google Vehicle Ads
Google Vehicle Ads are officially here, but maximising their effectiveness will still require some effort. Luckily, we're here to help. We're...
Site Showcase: Motio
Getting a new website doesn’t have to be an intimidating or overwhelming task. At Spidersnet we work hard to make sure that, whether you are an...
Google Vehicle Ads are Coming – What You Need to Know
It's official! Google Vehicle Ads are coming to the UK! But why is this such a big deal? And how can it help your business? That's where we come...
Getting Started with Autopromotor Social
Did you know that you can add Autopromotor Social to your account yourself, without even having to get in touch with us? One of the great new...
5 Ways To Improve Your Dealership’s Online Presence
There are many ways to promote your dealership online, and there is no escaping the fact that your dealership's online presence is vital to...
Spidersnet picks up TWO Car Dealer Power Awards and one highly commended
The Car Dealer Power Awards are some of the most prestigious and hotly contested awards within the automotive industry. Organised by Car Dealer...
Consumer Duty for Car Dealers
We’re now less than a month away from the Financial Conduct Authority’s (FCA) new Consumer Duty coming into effect. The FCA’s new regulations...
An Introduction to Facebook Automotive Inventory Ads
What are Facebook Automotive Inventory Ads?
Motor Trader Independent Dealer Awards 2023
The Motor Trader Independent Dealer Awards honour and celebrate the very best in the Independent Motor Sector, aimed at independent, non-franchised...
It’s Official – We have been ‘Highly Commended’ by Car Dealer Magazine!
We are very proud to announce we have been 'Highly Commended' in two categories of the Car Dealer Power Awards 2022. We’re delighted to be...
Autopromotor just got even better, introducing Autopromotor Service
Here at Spidersnet, we understand that consumers are now looking to purchase products and services online, and in their own time. With this in mind,...
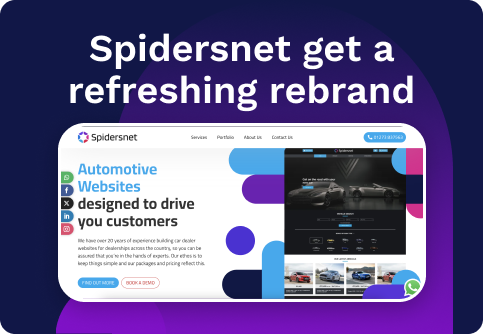
Spidersnet reveal a refreshing new rebrand!
This month has seen us reveal a refreshing new rebrand going into the second quarter of 2022! Over the last two years, we’ve made huge changes in...
A Quick Intro: Autopromotor Books
Our stock management system has been in action for over 20 years. Autopromotor allows customers to upload vehicle adverts to their site, broadcast...
Autopromotor Pro App awarded ‘Highly Commended’
In October, the team at Spidersnet received some exciting news. The Autopromotor Pro Smartphone App had been shortlisted for an award! This was for...
Autopromotor Pro App nominated for Motor Trader Industry Award
Here at Spidersnet we are delighted to announce that our Autopromotor Pro smartphone app has been shortlisted for the IT Innovation of the Year...
Autopromotor Pro: The brand new Autopromotor App
The Autopromotor Pro mobile app is now live and is set to revolutionise the way you manage your business. This innovative app, which is available on...
10 reasons to download the Autopromotor App
Autopromotor Pro is now live and the brand new, cutting-edge Autopromotor Pro Mobile App is ready to use. So if you are an Autopromotor Pro...
Generate remote sales with Codeweavers!
Codeweavers are offering FREE ACCESS to some handy solutions designed to help dealers. Leading automotive finance software provider Codeweavers is...
Study reveals that car dealerships lead the way when it comes to Google Business Profile
We’ve spoken at great length about the importance of Google Business Profile (Formerly Google Business Profile) to motor dealers. Our Learning Hub...
VISITOR CHAT: In today’s digital world customers expect immediate answers!
Our latest Partner Blog post comes from automotive live chat specialists Visitor Chat. Spidersnet has teamed up with Visitor Chat meaning they are...
