What is Google Analytics?
Table of contents
Whether you're running a small independent dealership or managing a larger franchise, data-driven decisions can significantly impact your sales and marketing success. That's where Google Analytics (GA) comes in. This powerful tool allows you to track and analyse the performance of your dealership's website, giving you insights into your customers' behaviour, preferences, and how they find you online.
What is Google Analytics?
GA is a powerful tool that you can use to track traffic and other patterns on your website. It's one of the most powerful web analytics applications out there and can offer you a huge number of insights into how your customers behave and how your dealer website is performing.
Once you have logged in to GA you can take a look at a number of things. You can see the number of people that are visiting your website on a daily, monthly, and weekly basis; you can have a look at where they are coming from; you can see which pages on your site perform the best; and you can look at a whole host of other useful data.
Measure traffic
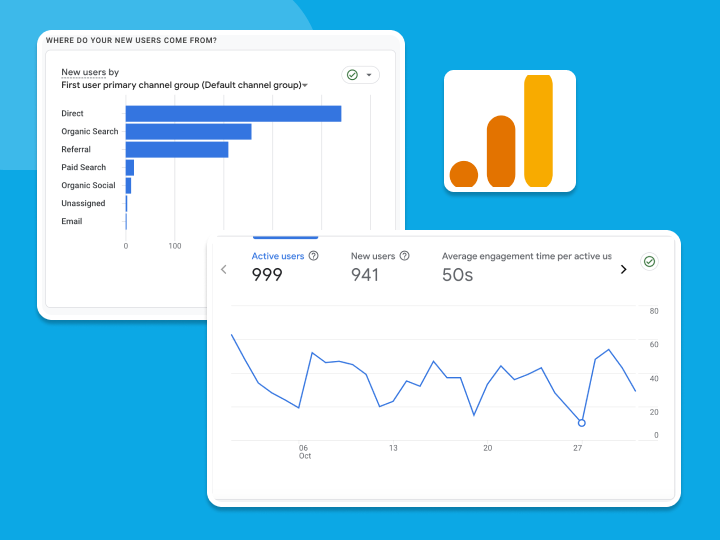
One of the most important things to track on GA is your traffic levels. One of the first things that you'll see when you log into account is a graph that resembles the one below. This shows you how many people have been on your site in the specified time zone. You are able to adjust time zone as you wish.
This graph shows you exactly how many people have been to your website in the time listed. To change the period of time that you wish to view, head to the top right hand corner and select the dates you wish to choose.
You can also use this box to compare the timeframe you've selected to the same timeframe the previous year or any other set of dates. Once you have selected your comparison, two different lines will appear in your graph allowing you a closer look at the difference.
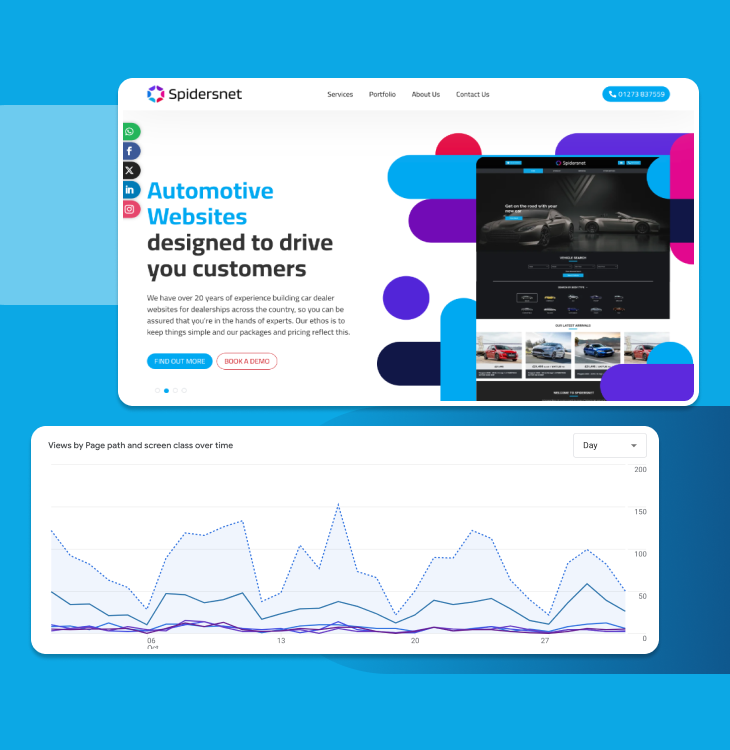
Find out which pages perform the best
This graph shows you exactly how many people have been to your website in the time listed. To change the period of time that you wish to view, head to the top right hand corner and select the dates you wish to choose.
You can also use this box to compare the timeframe you've selected to the same timeframe the previous year or any other set of dates. Once you have selected your comparison, two different lines will appear in your graph allowing you a closer look at the difference.
This will bring up all of your best performing pages, offering you a range of stats. Here is a small rundown of what the different columns mean.
Pageviews
This column is dedicated to the number of times people have viewed the page. You can see which pages are being viewed more times than others, giving you a good idea as to which pages are more popular with your users. If you feel that some pages aren't getting enough traffic, compared to others then you may wish to make some changes to your site.
Unique Pageviews
Pageviews, as mentioned above, shows the number of times your pages are being viewed, unique pageviews shows the number of individual people who have viewed your pages. This is similar to the point above, but gives you a clearer idea of how many individuals have been on different pages of your website.
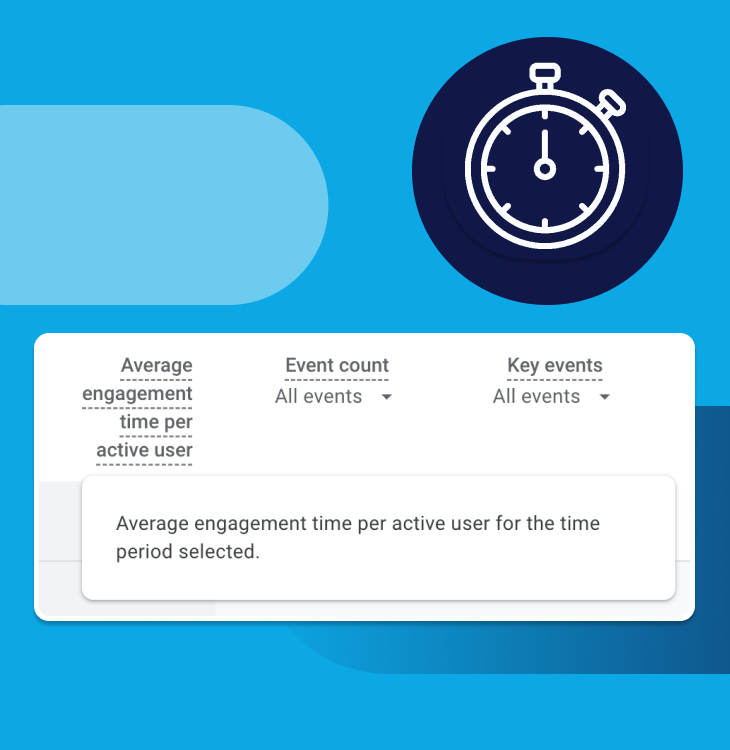
Avg. Time on Page
This is the average time users are spending on each page. If some pages have very low average times, then they may need improving. You want to ensure that your users are interested in your dealership's website, and aren't flicking through the pages quickly before leaving. If pages do have very low average times, then why not spend some time adding more useful information?
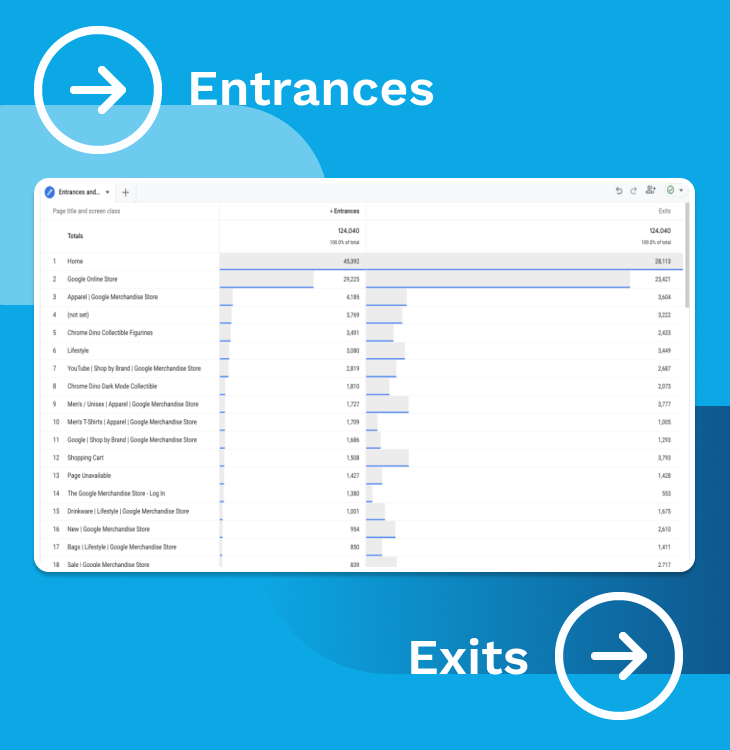
Entrances
This statistic shows you how many times people have entered your website through the specific page or set of pages. It can give you an idea of which pages people are landing on first. If there are pages with large numbers of entrances, but which also look poor and don't represent your brand well, then you should make improvements. You don't want people's first impressions of your site to be poor.
Bounce Rate
This number is the percentage of people who entered your site via the specific page, before exiting straight away. The lower this figure the better. Someone who has 'bounced' has essentially only visited that one single page, and hasn't gone on to further explore your website. Pages with high bounce rates should be tweaked to try and keep people on your site.
Percentage Exit
This column is the percentage of people who have visited the page, or set of pages, and then left your website. Viewing these figures you can get an idea of which pages are causing people to leave your site.
Where has your traffic come from?
So, you can see how many people are visiting your website and which pages perform best. And, as shown above, you can also see how your users are behaving when they land on certain pages. Another very useful aspect of GA is the 'Acquisition' tab, which allows you to see where your visitors have come from.
To see where your traffic is coming from, click on the 'Acquisition' button on the left hand side of your page and then select 'Channels' below the 'All Traffic' sub header. This will then bring up a run-down of all of the different channels people have used to access your website.
Below the graph you will have a list of all of the most popular channels through which people are getting to your website. Not only can you see which channels are bringing in the most traffic (the 'Sessions' column), but you can also see how that traffic is behaving with the same columns listed above.
The most common channels that you are most likely to come across are as follows…
Direct
Direct is literally people who have gone straight to your website. This means that they have typed your full URL into their web browser and have gone straight there. This doesn't count if they have Googled your business name first, as they will appear under the next heading.
Organic Search
This is the number of people who have arrived on your website through search engines. They may have searched for your business directly, or have stumbled upon you on whilst searching for a new car or other services that your dealership may offer.
Social
As you might expect, 'Social' refers to any users who have accessed your website via social media. If you have posted a link to your site on Facebook or Twitter and someone has clicked on it they will be recorded here. This is a good way of seeing how much traffic your social media efforts are generating for your website. Even if you don't have your own social channels, you may still get some visits via social media as random people may be sharing links to your stock on their pages.
You can find out which social channels are sending you the most traffic by clicking on 'Social' in the list. This will then show you a run-down of where your users are coming from. Most of your social traffic will probably come from Facebook and Twitter, but some may come from LinkedIn and other channels too.
Paid Search
Traffic that comes to your site through any advertising platforms – I am mainly talking about Google AdWords here – is referred to in GA as 'Paid Search'. If you have not carried out any paid online advertising then you can ignore this part of the report as it is not relevant to you.
Referral
Traffic that is listed as having come through 'Referrals' is any traffic that has arrived on your website via a link from another site. If you click on the 'Referral' button you can then see which websites the traffic has come from and how it behaves. You may discover that you are getting lots of referral traffic from a website you didn't even realise was linking to you.
As with most of the above, this one is pretty self-explanatory. Traffic listed as 'Email' is traffic that has come from a link in an email. This could be email campaigns you have been doing yourself, or links in any other emails being sent to and from anyone else. It's that simple. If someone has clicked on a link in an email and it has taken them to your website, they will be listed here.

First and last impressions
We made reference to these aspects of GA earlier, but it is worth spending some time looking at which pages people are seeing first, and which pages people are seeing before they exit your website. By analysing these two factors you can make some informed decisions about changes that may or may not need to be made to your site.
First impressions (Landing Pages)
If you want to see which pages people are seeing first, you should head to the 'Behaviour' section on the left hand side of your GA screen and select 'Landing Pages' from beneath the 'Site Content' sub-header. See below for an example…
This will bring up the pages that people are seeing the most when they arrive on your website. In most instances your homepage will be the most popular. However, by looking at which other pages people are seeing first, you can start to get an idea how good a first impression you make.
If the most popular pages in this section are poorly put together, don't offer the right amount of relevant information, or simply look bad, then you most certainly need to make changes. You don't want a large number of people being put off your dealership because they have had a bad first impression from your website!
Last impressions (Exit Pages)
Another very important thing to look into is which pages are causing people to leave your website. To view this data, you simply click on the option below 'Landing Pages' which is called 'Exit Pages'.
It's most likely that your homepage will see the most exits, however, if you spot that another page is also seeing a lot of exits then you may wish to investigate why. You should aim to keep people on your website as long as possible.
You can improve the pages that lead to the most exits by adding in call-to-actions or links to other pages. By doing this you may see the number of exits fall as you keep your users engaged for longer. Or, you can simply improve the pages themselves as they may be offering bad user experience, which often leads to people leaving your site.
In conclusion
Google Analytics is more than just a tool—it's a window into how your customers interact with your dealership online. By tracking key metrics like website traffic, user behaviour, and conversion rates, you can make informed decisions that drive leads, boost engagement, and ultimately, sell more cars.
The good news is all of our websites are integrated with GA, and you can see results through your Autopromotor Dashboard, meaning you don't have to jump between platforms if you don't want to.
Want to do more with your digital marketing? We can help!
At Spidersnet, we have a variety of digital marketing packages that help you to make the most of your business.
Find out more todayReady to transform your
dealership?
Let's chat about which package best suits your business.